Monitoring
Log monitoring
The log files provide a chronological list of activities that occurred on a node. These activities can be analyzed further to provide monitoring for a particular node or the network in general. As the logs are created in JSON format, it is possible to pipe the log messages to additional monitoring software. With monitoring software, the node operator can filter automatically for certain events and visualize them through a front-end application. In addition, it could also be used to send notifications to the operator in case of an emergency.
Performance monitoring
New Relic is used to monitor the activities inside of the application. It enables a detailed insight into the system and keeps track of the performance of all activities, e.g. an HTTP API call or a background process from Lisk Core jobs queue.
The following steps provide the user with the insights of why and how to monitor your Lisk Core node using the New Relic instrumentation.
Enable New Relic
Get the New Relic license key
Firstly, it is required to register an account at https://rpm.newrelic.com. After successful login, select ''Account settings'' in the account dropdown box in the New Relic UI. From the Account information section on the right side of the summary page, copy your license key.
Add the license key
To enable the performance monitoring on your node, ensure you have an environment variable NEW_RELIC_LICENSE_KEY set:
Application and Source code
export NEW_RELIC_LICENSE_KEY=XXXXXXXXXDocker image
cd lisk_repo/docker (1)| 1 | Navigate into the docker directory. |
Inside, edit docker-compose.override.yml and add your license key as shown below:
version: "3"
services:

  lisk:
    environment:
      - NEW_RELIC_LICENSE_KEY=XXXXXXXXX
Then save your changes to the file, and reinitialize Docker so it can use the new environment variable.
docker-compose up -d (1)| 1 | Restart Docker containers. |
An additional method of adding the license key is to edit the newrelic.js file, which can be found in the root directory of the Lisk Core installation.
cd lisk_repo (1)| 1 | Navigate inside the root folder of Lisk Core. |
Once inside the root folder, open the file newrelic.js and search for the option license_key, and add your license key as a string value as shown below:
/**
 * Your New Relic license key.
 *
 * MUST set the license key using `NEW_RELIC_LICENSE_KEY` env variable
 * if you want to enable the monitoring of the lisk node
 */
license_key: 'XXXXXXXXX',
After adding the license key, save your changes and reload your node.
Restart Lisk Core node
Start the node normally as shown below:
bash lisk.sh start (1)
npx pm2 start lisk (2)
docker start container_id (3)| 1 | Start Lisk Core Application. |
| 2 | Start Lisk Core Source code. |
| 3 | Start Lisk Core Docker image. |
In the case whereby it is already running, then perform a restart as shown below.
bash lisk.sh reload (1)
npx pm2 restart lisk (2)
docker restart container_id (3)| 1 | Restart Lisk Core Application. |
| 2 | Restart Lisk Core Source code. |
| 3 | Restart Lisk Core Docker image. |
Keep your node busy
It is required to perform some system activities in order to monitor them. In order to accomplish this, keep your node busy by performing actions like taking a snapshot, syncing your node, or running various API requests against it. Even if they are not performed, New Relic can monitor the internal activities of the system. For example, different queue jobs.
There are several options to create workload on your node which are described below:
Option 1: Lisk Core test suite
| The Lisk Core test suite is only available for Lisk Core from Source. |
The unit testsuite is not suited for this purpose, as unit tests are not executed in the context of the running application.
|
The README of the Lisk Core repository in Github describes how to run the testsuite.
Option 2: Apache bench
Apache Bench is a generic benchmarking tool designed to measure the performance of HTTP servers.
For example the following request shown below can be performed:
now && ab -n 200000 -c 1 -k "http://127.0.0.1:7000/api/accounts?publicKey=4e8896e20375b16e5f1a6e980a4ed0cdcb3356e99e965e923804593669c87ad2"now: Appends the current system time on top of the Apache Bench output.
In case you wish to compare the New Relic benchmark results with the Apache Bench output, it is convenient to add New Relic in order to ascertain exactly when the benchmark started, as Apache Bench is not actually logging this.
-n: The number of requests that are executed.
-c: The number of requests to perform in parallel.
-k: Enable the HTTP KeepAlive feature, i.e., perform multiple requests within one HTTP session.
Option 3: Siege
Siege is another tool for benchmarking the performance of HTTP servers.
For example the following request shown below can be performed:
siege -c 10 -t 30m http://127.0.0.1:7000/api/blocks-c: Number of requests to perform in parallel.
-t: Allows the test to be run for a selected period.
Analysis with New Relic
The following example below shows a case study, whereby it is required to analyze the performance of API GET /api/transactions endpoint, in order to ascertain the following information:
-
If there are any bottlenecks existing in the database level.
-
Which of the database queries is taking the longest time.
To accomplish this, the following steps below must be followed:
$ cd ~/lisk_repo
~/lisk_repo $ export NEW_RELIC_LICENSE_KEY=xxxxxxxxxxx
~/lisk_repo $ npx pm2 start lisk
The next step is to start performing some requests using Siege as shown below:
siege -c 10 -t 5m http://127.0.0.1:4000/api/transactionsThe script will automatically continue to send the HTTP requests against your node for 5 minutes (-t 5m).
During this time period, please be aware of the following points:
-
You may wish to disable the cache on the node to acquire real performance analysis. To do this, set
cacheEnabledin configuration tofalse. -
It may not be possible to see the viable results if your development blockchain dataset is empty. This could be changed by running your tests against the Testnet data.
-
It may take a couple of minutes to show the analyzed results in the New Relic interface so please be patient.
To see the New Relic instrumentation results, please log in to https://rpm.newrelic.com, and select APM from the top menu.
The first screen is the list of applications. Depending on which network your node is running on, the application title will be visible as shown in the image below:
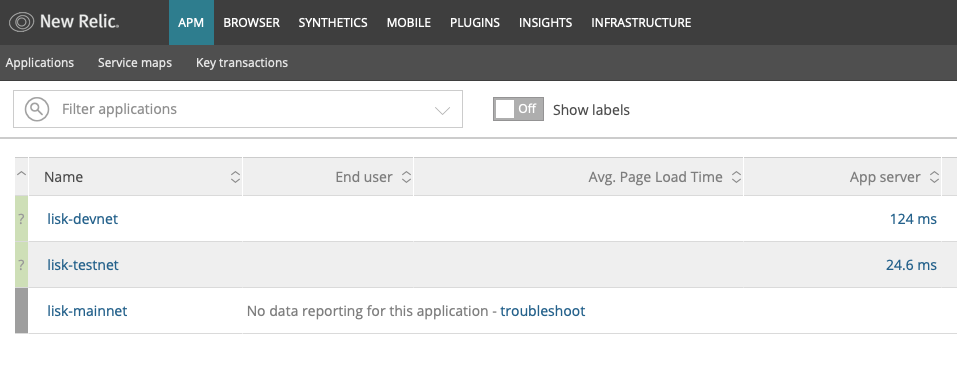
Please select the specific application by clicking its name. The following dashboard will be visible as shown below:
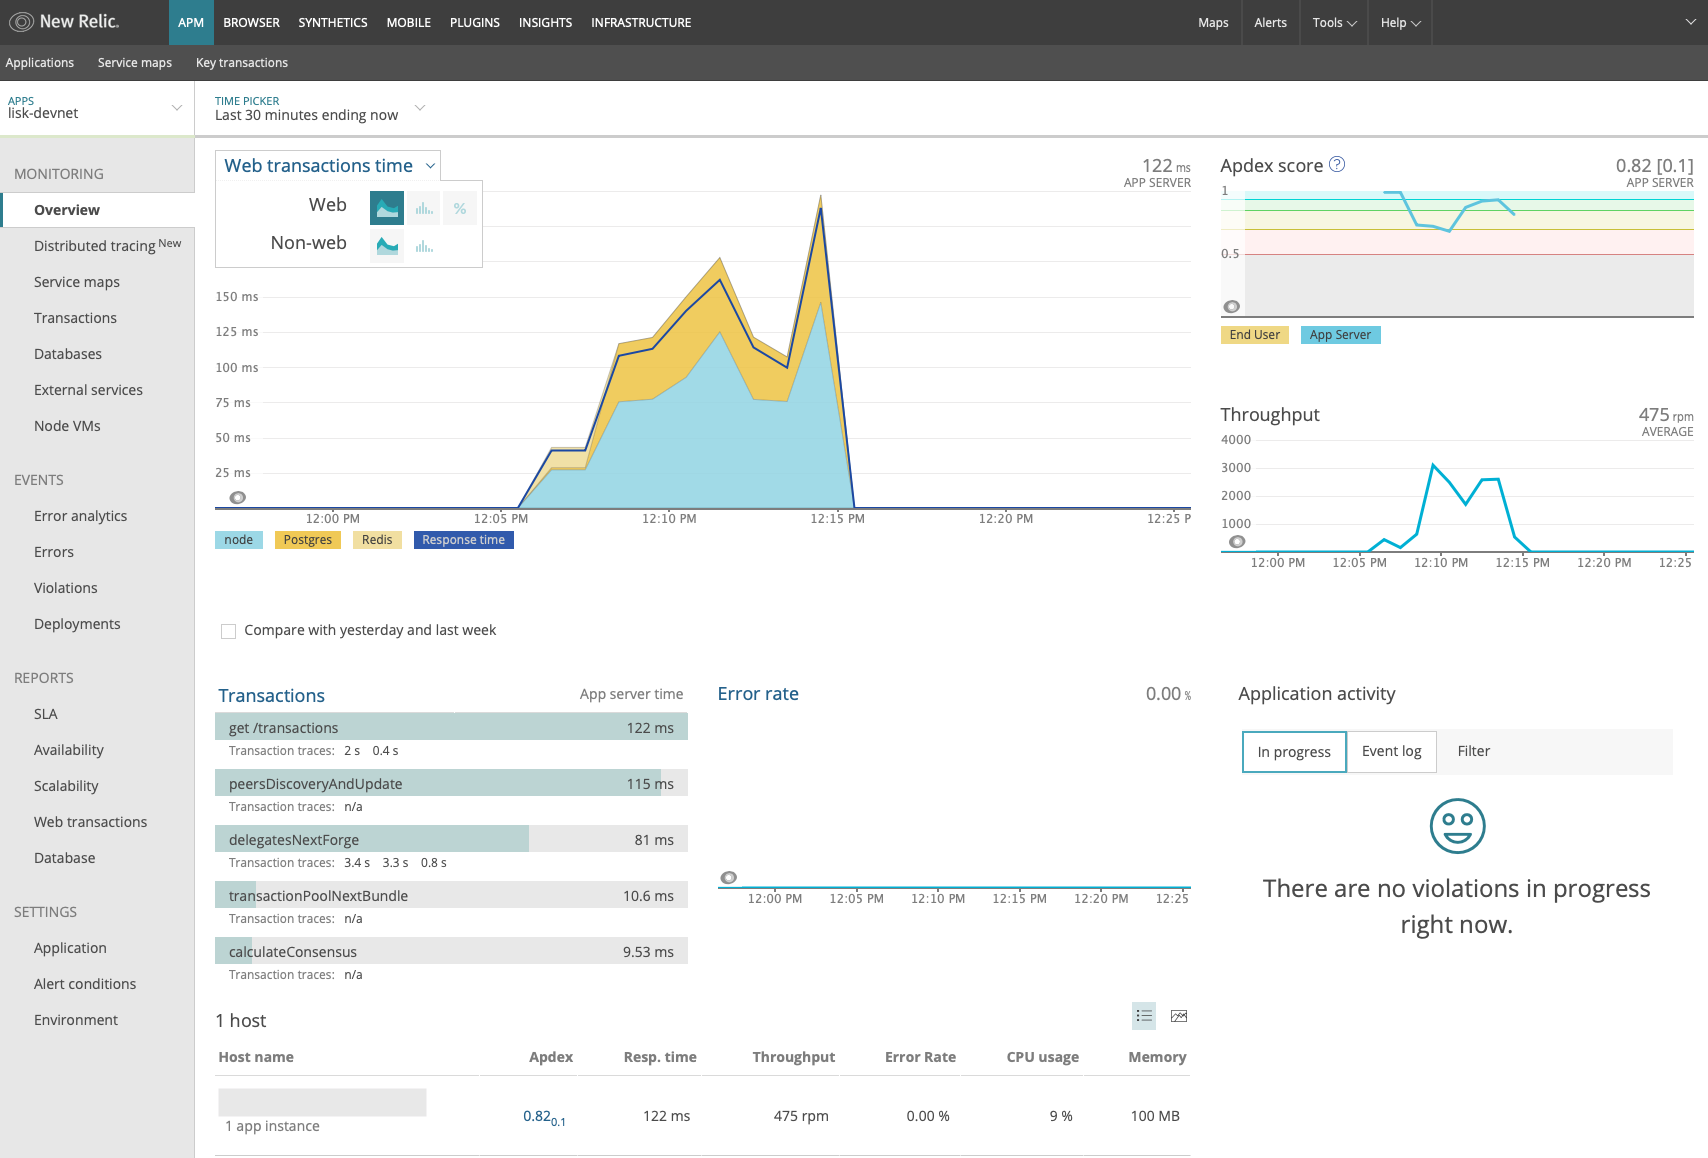
In order to become conversant with the finely-grained details of this dashboard, please read https://docs.newrelic.com/docs/apm/new-relic-apm/getting-started/introduction-new-relic-apm.
At this point, during the experiment, only the HTTP requests against our node were executed (GET /api/transactions), so there is only one section which shows interesting results. Please select "Transactions" from the left menu in the above screen. Now follow the detailed instructions in the image shown below:
| Just for clarification, the New Relic transactions have no relation with Lisk transactions. It is just the grouping term that New Relic uses to display analytics. |
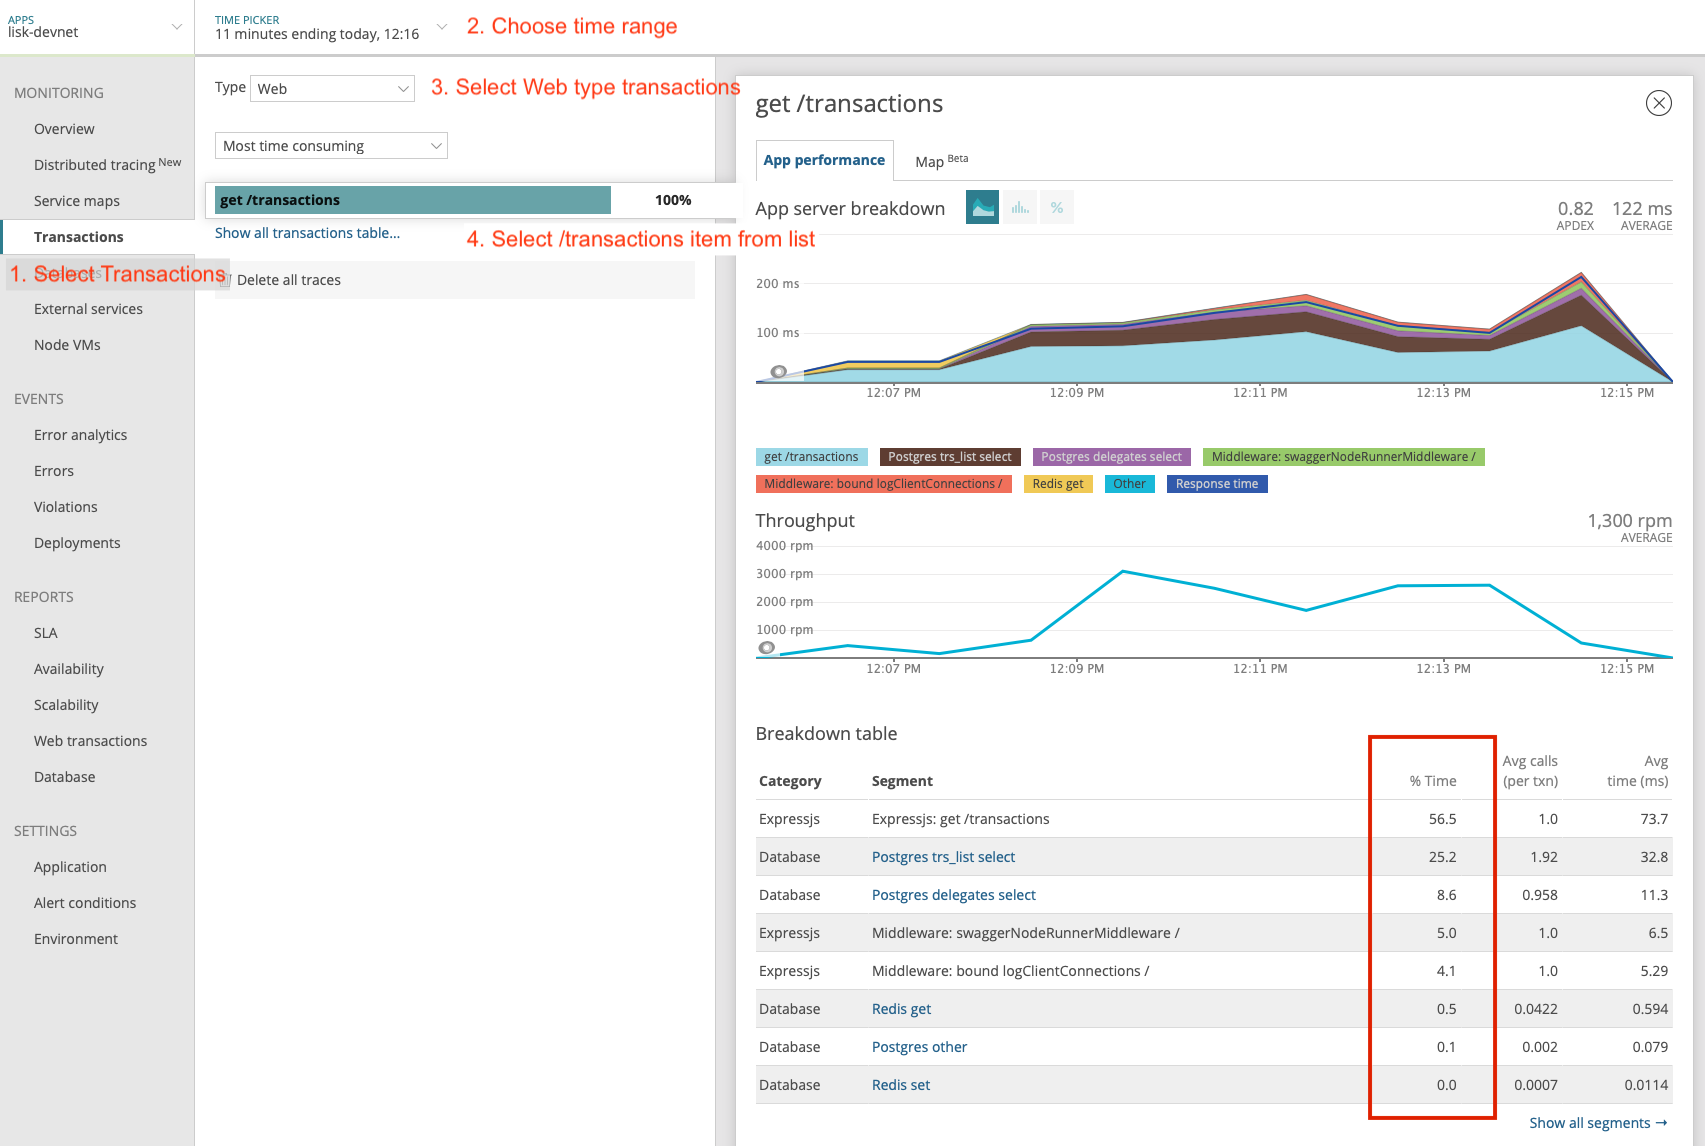
In the above image the most valuable information is highlighted in the rectangle, which provides the following information:
-
The majority of the time (56%), was spent in ExpressJS which is a Node.js module.
-
During the experiment, one database view (
trs_list) and one database table (delegates) were involved in the persistence layer. -
Querying to the database table
delegateswere fast. -
While the query to the database view
trs_listwas a bit expensive. -
On average API calls for
GET /api/transactionstook 122ms.
If it is required to have this information in a tabular form, in order to create a presentation please click on the "Show all transactions table" link. This will provide the following view as shown below:
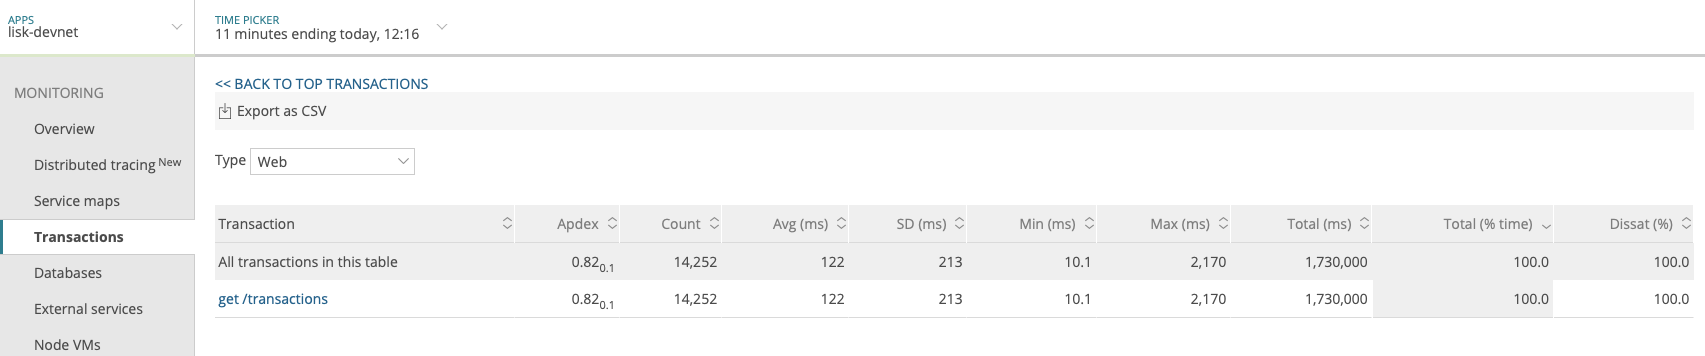
From this screen it is possible to see the following information described below:
-
In the selected time range a total of 14252 requests were made to
GET /api/transactions. -
The slowest request took 2.17 seconds.
-
The fastest request took 10ms.
-
The average time for requests was 122ms while the standard deviation was 213ms.
-
The difference between the average and standard deviation indicates there were small spikes between requests.
-
It is possible to export data to CSV format from this screen in order to maintain records or share with others.
If it is required to debug deeper into which transactions actually took 2.17 seconds, please return to the previous screen, start to scroll down and the transaction traces will be visible.
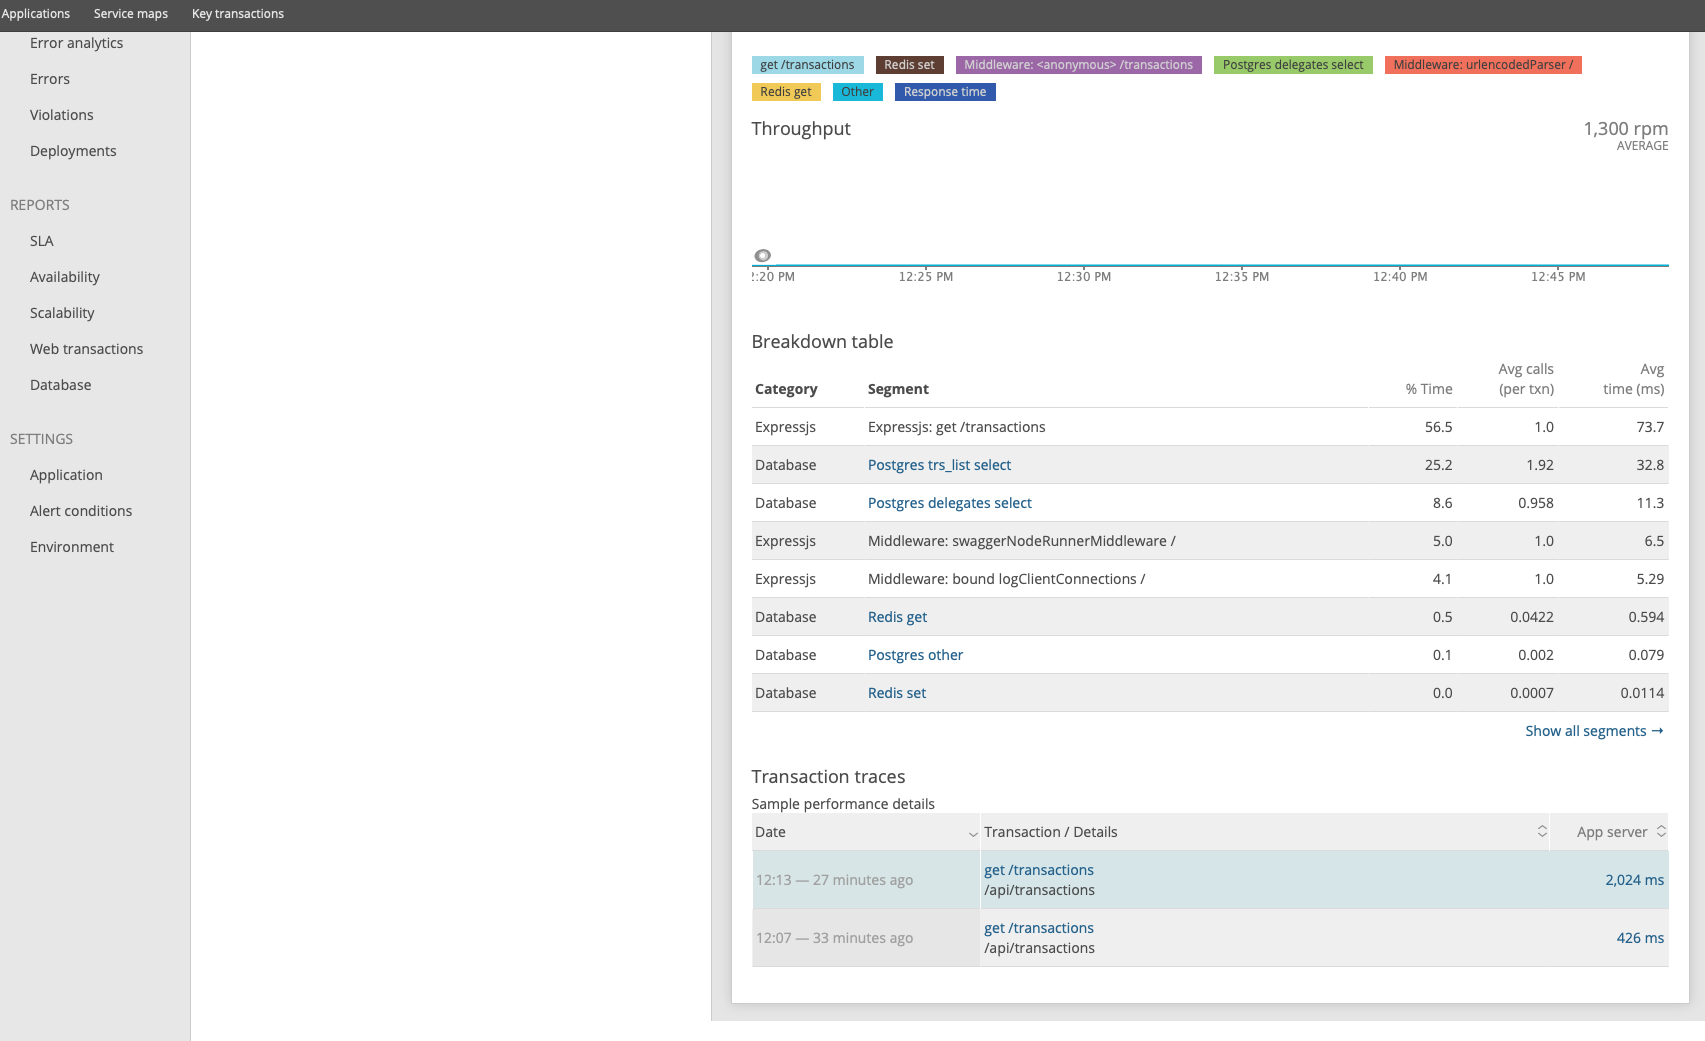
Here it is possible to see an overview of an individual transaction which took a longer time period and is considered as "slow".
The threshold which defines the "slow" transactions is configured in file newrelic.js under transaction_tracer.explain_threshold, which is currently 100ms.
Every request which took more than 100ms will be considered as "slow" and logged as the trace by New Relic.
It is possible to debug further and verify what caused this request to be "slow", by clicking on any of the trace links in the list shown below:
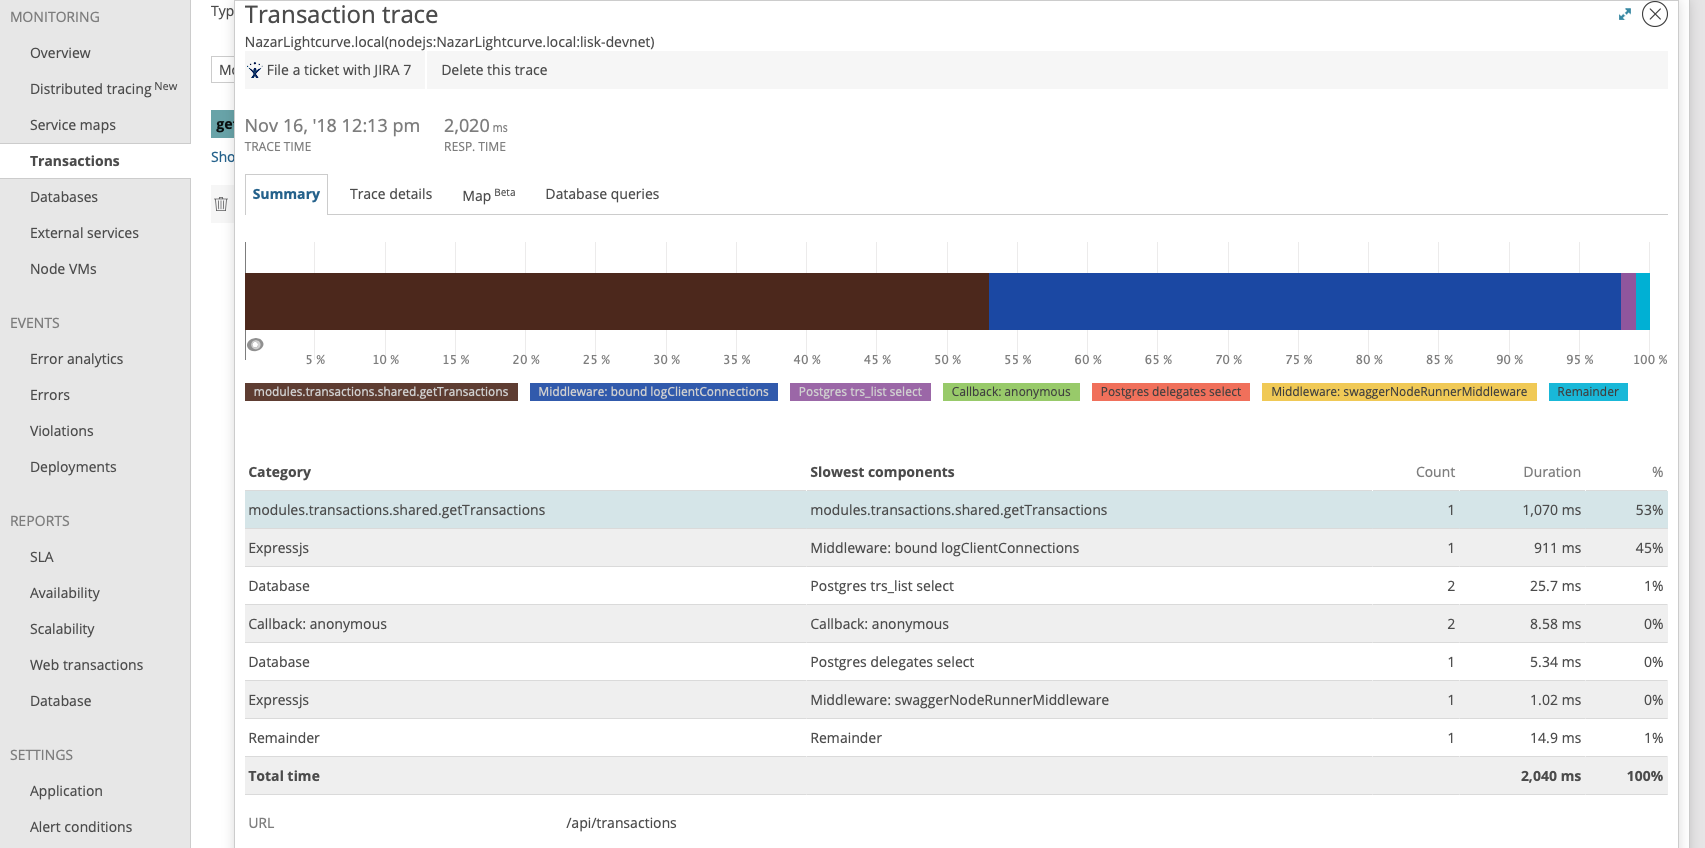
As shown on the above trace summary, most of the transaction’s time was spent in two functions modules.transactions.shared.getTransactions and Middleware: bound logClientConnections.
It is possible to view the trace detail in order to to see more information and the call stack.
it is also possible to click on "Database queries" to see which queries were executed during this request.
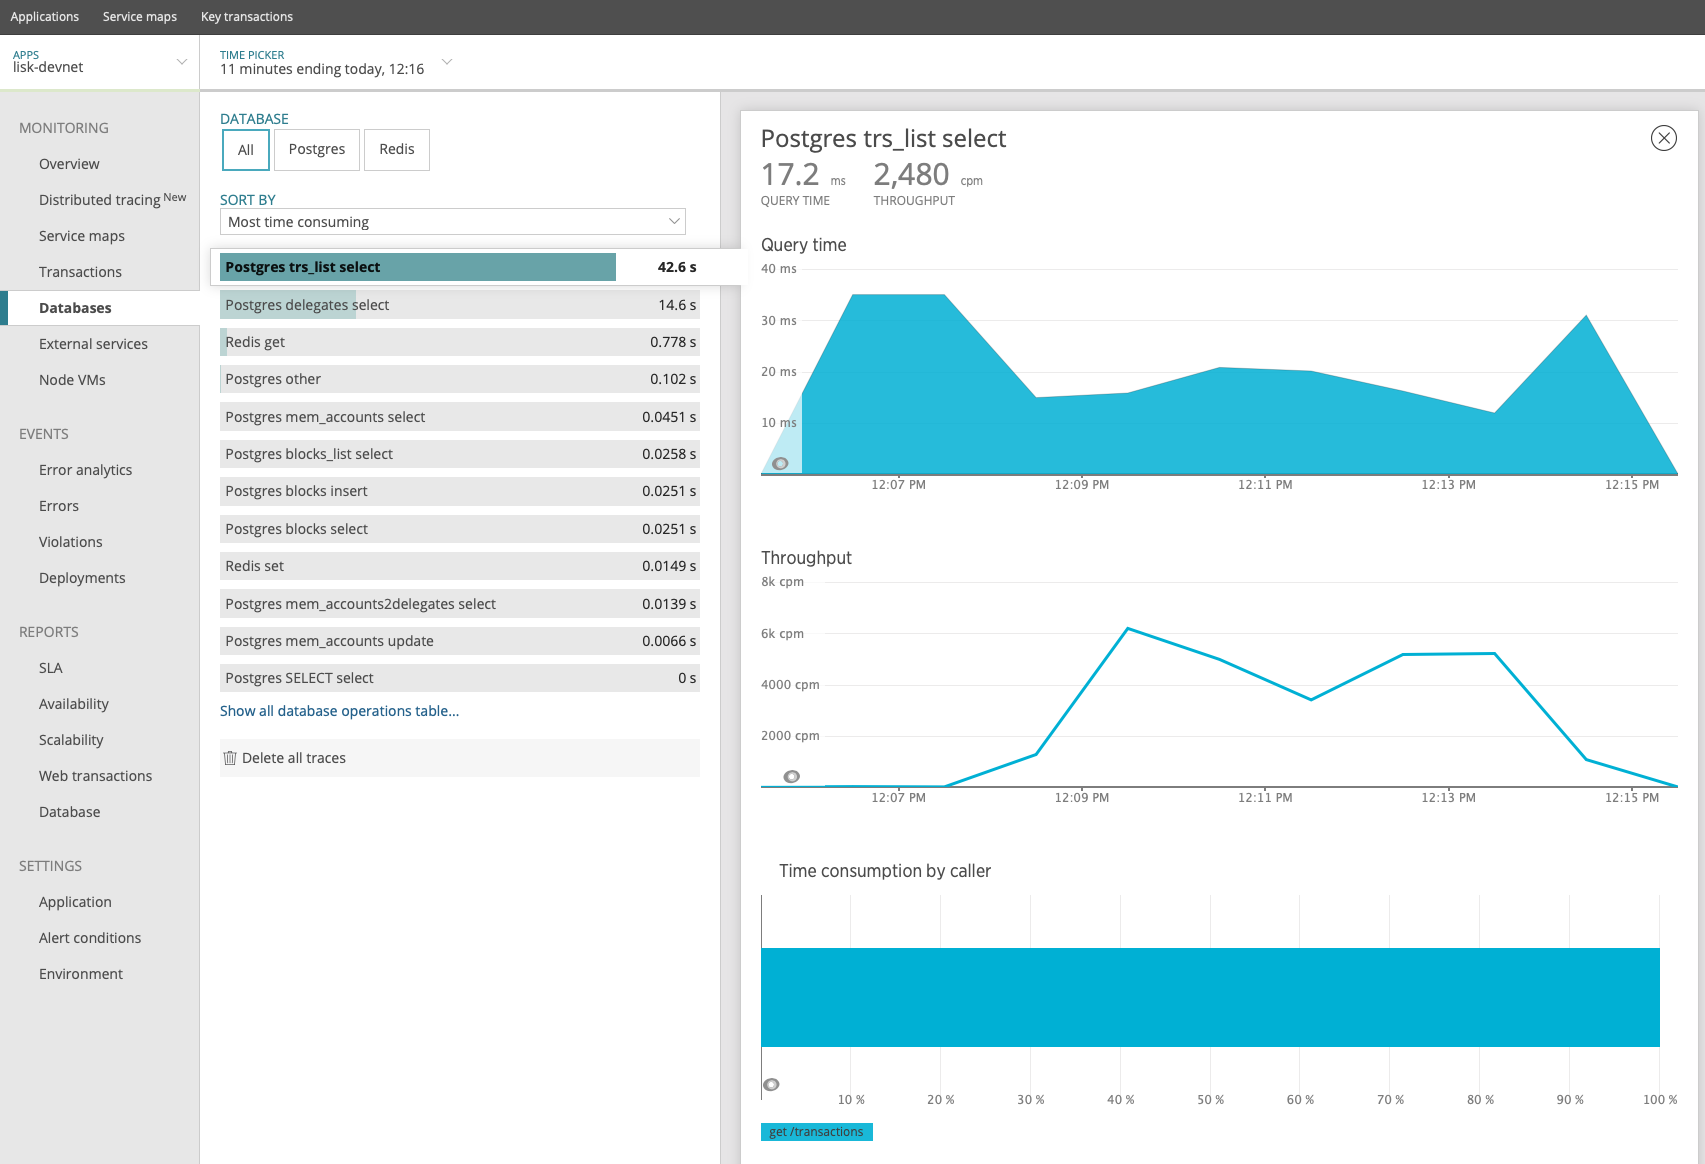
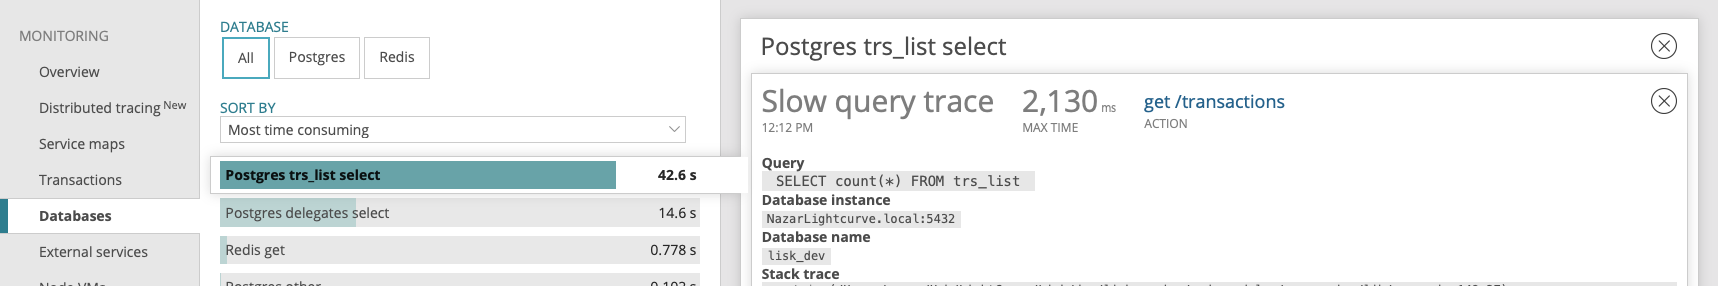
Furthermore, the database query which is taking most of the time can also be found. This can be accomplished by clicking on the left side menu for "Database", and then to sort by "Most time consuming" and then select the top of the list.
Scroll down on the page shown above, and the the slow queries can be viewed as shown below:
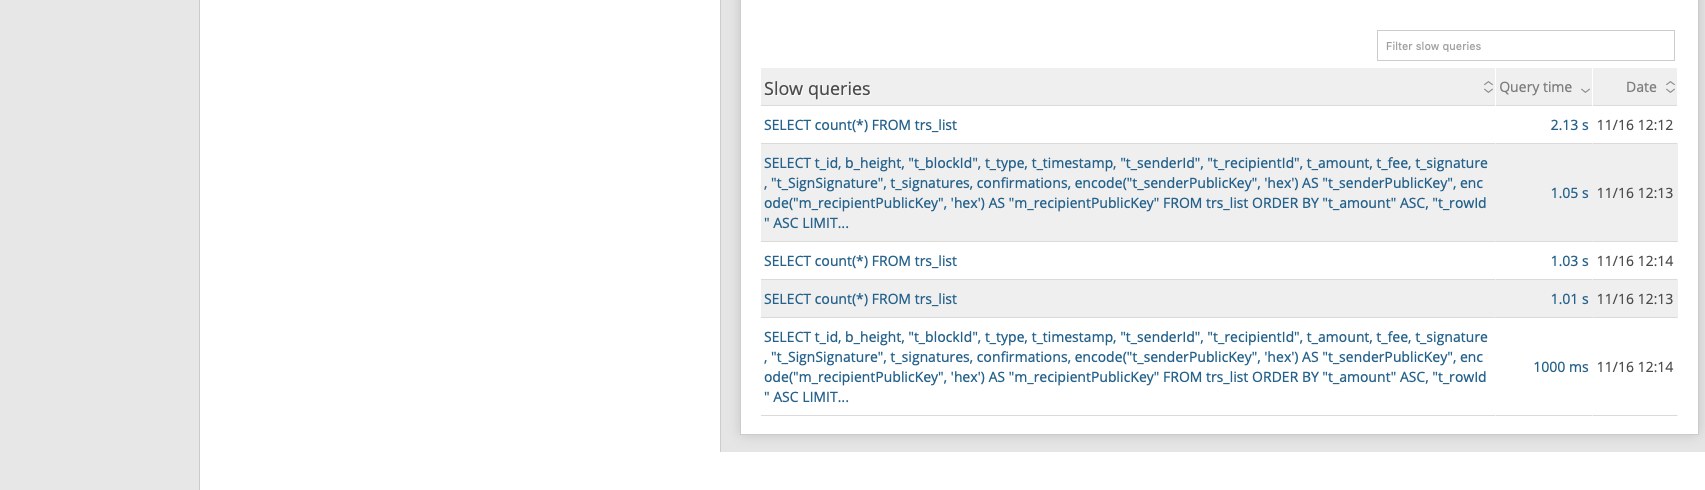
By analyzing the above diagrams, it is possible to conclude the following points below, assuming that all the statistics are strictly within the experiment time range:
-
The slowest queries in the system are queries for
trs_listview. -
For that database view
trs_listthe slowest query is theSELECT count(*) FROM trs_listwhich took 2.13 seconds. -
There are a few other queries in the on
trs_listview which took more than 1 second. -
By clicking on the top slow query, it can be seen that the query was executed during
GET /api/transactions.
The above use case should help the user to understand the usage and benefits of New Relic. Please contact us if you wish to know more.
FAQ
I am not seeing Lisk Data in the New Relic APM dashboard?
Please ensure to check the following points:
-
Are you using a valid license key for your account?
-
Have you exported the license key on the node where you are running Lisk?
-
Have you selected the proper time range in New Relic APM?
-
Are you looking on the right page? E.g. you may be searching web transactions but had selected Non-Web transactions in the UI.
-
If you just run the node, give it a few minutes let New Relic crunch the data and display the results in the UI.
Are the performance measures consistent?
-
Assuming you are using the same machine specification to run different scenarios, the statistics will be consistent.
-
It is recommended not to benchmark on your development machine, as it can have another workload during different test runs.
-
If you are using AB or Siege, always use the same number of connections to simulate the same request load on a node.
How is it useful for me as a Delegate or Exchange?
-
Performance of the machine may affect the behavior of interacting with the node.
-
You can create alert policies on New Relic to inform you when your app is taking more memory.
-
You can set alerts to see if the database is getting slow.
-
You can track if errors occurred in the system which were not handled correctly.